
Mastering Time Series Analysis with Help From the Experts
This article originally appeared on KDNuggets.com here. For more, visit https://www.kdnuggets.com/)
Read this discussion with the “Time Series” Team at KNIME, answering such classic questions as "how much past is enough past?" others that any practitioner of time series analysis will find useful.
 I am here with the dream team behind the components, courses, webinars, and all other material developed to solve time series analysis problems with KNIME Analytics Platform: Prof. Daniele Tonini, teaches statistics, machine learning and of course time series analysis at the Università Bocconi in Milan (Italy); Corey Weisinger, the data scientist at KNIME specialized in signal processing and time series analysis; and Maarit Widmann, also a data scientist at KNIME, whose focus is scoring metrics and then, of course, time series analysis.
Time series analysis is one of the many disciplines in the field of data science. It is a bit the neglected little sister of machine learning. While we find tons of courses on machine learning and artificial intelligence, the number of courses available, for example in academic programs, for time series analysis is limited. Even when exploring this limited amount of educational material, it is really hard to find a comprehensive book, course, or webinar covering all steps required and all options available for time series analysis.
[Rosaria] So, my first question is: Why is there so little educational material on time series analysis? And, when available, why so confused?
[Daniele] Time Series Analysis comes from the union of procedures rooted in statistics, machine learning, and signal processing. Statistically based procedures require the verification of a number of often unrealistic statistical hypotheses; machine Learning procedures just require a large amount of data; and signal processing operations aim at transforming the data with no prediction ambitions. All three sets of procedures grew over time, but separately, side by side. Thus, often a course or a book focuses in depth on only one of those aspects, overlooking procedures from the other areas.
[Rosaria] Is this why you created your own Time Series Analysis course for practitioners?
[Maarit] There was a demand for a course like this by the KNIME user base. Some data scientists work specifically with time series and were interested in guidance on the theoretical steps in a time series analysis project and on the nodes and components in KNIME Analytics Platform that are useful for that.
[Rosaria] Talking about the features and nodes in KNIME Analytics Platform specifically for time series analysis, what are they and where can I find them?
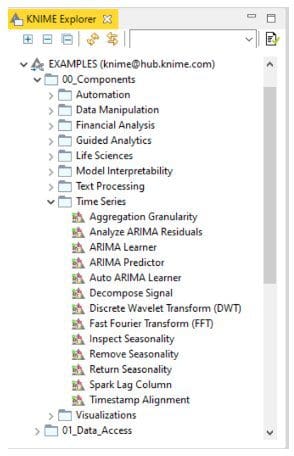
[Maarit] The KNIME components for time series analysis can be found in two places: the KNIME Hub and in the EXAMPLES space. On the KNIME Hub just search for “time series analysis” and select “Components”. You will find all of them. Then just drag and drop the component you need into your workflow, configure it, and you are ready to go. It’s the same from the EXAMPLES space, under “00_Components/Time Series” in the KNIME Explorer panel in the top left corner of KNIME Analytics Platform. These components implement commonly required procedures for preprocessing and model building for time series analysis: from time aggregation, ARIMA and auto-ARIMA models, seasonality inspection and removal, through to seasonality restoring, Fast Fourier Transform, and more.
[Rosaria] Are these components based on integration with some special libraries?
[Corey] Some just include KNIME native nodes, some are based on the “StatsModel” Python library. This is why some of these components require a Python installation and the KNIME Python integration.
[Rosaria] Where can I find examples on how to use these components for time series analysis?
[Maarit] Again, on the KNIME Hub you can find hundreds of example workflows on time series analysis. Just type “time series analysis” and select “Workflows”, and you will probably find the example you need.
[Rosaria] What can I do then, if I need a special function, like the Ljung-Box test or the Garch method, and this is not available in the time series components?
[Corey] Some special functions have not been integrated in the time series components yet. In such a case, you can resort to Python and R libraries via the KNIME Python and KNIME R integration.
[Rosaria] Could you provide some classic use cases for time series analysis?
[Maarit] The most common application is demand prediction, demand prediction for anything: power needed in a city, customers in a restaurant, visitors to a web page, packages of beer on the shelves, … The idea here is to predict the next number in future based on previous numeric values. Another classic application is anomaly detection. Given a time series, detect sudden or progressive unexpected change. Also speech recognition, language processing, price forecasting, stock market predictions, survival analysis, to name just a few.
[Rosaria] Now for the most frequently asked question. Which family of models is best to use for time series prediction: ARIMA, Machine Learning regression models, or LSTM based recurrent neural networks?
[Daniele] An important point here is what is meant by “the best model” As we’re going to explain in the forthcoming time series analysis courses, it’s not just about out of sample performance comparison. There are other important items you need to consider in your model selection procedure, such as:
- Forecast horizon, in relation to TSA objectives
- Type/amount of available data
- Required readability of the results
- Number of series to forecast
- Deployment related issues
Thus, all of the proposed models have their pros and cons. ARIMA has been around the longest, but requires the verification of some statistical hypotheses and this is not always realistic to achieve. Machine Learning models, in contrast, often don’t actually rely on statistical hypotheses and just need a large amount of data. Some of them have actually been optimized to run on very very large amounts of data.
Which method works best depends - as usual - on your problem and your data. If you are dealing with data that can be transformed into stationary time series, in a reasonable amount of samples and with a reasonable number of regressors, then the ARIMA might yield the best results. However, if you are dealing with an exceptional amount of data, with multivariate time series that are very long and/or with many dimensions, then Machine Learning methods might be more efficient. For example, at the latest M5 time series competition, the challenge was based on a multivariate time series and the winner of the competition turned out to be gradient boosting algorithms from the LightGBM library, after years of ARIMA dominance.
[Rosaria] This is very interesting. One of the questions we have been asked was about dealing with the analysis of large amounts of data. Which methods can I use here?
[Daniele] When dealing with large amounts of data, traditional statistics based methods for time series analysis start showing their limitations. Most Machine Learning techniques, on the other hand, have been designed since the start to deal with large amounts of data, either via parallel computation or speed optimized algorithms.We are observing an increasing popularity of fast machine learning algorithms, such as for example those in the XGBoost library, to solve time series analysis problems.
[Rosaria] There has been a lot of talk recently about the success of LSTM units in recurrent neural networks when applied to time series analysis problems. Why should LSTM-based recurrent networks work better rather than traditional neural networks for time series analysis?
[Corey] Recurrent connections in a neural network introduce the time factor to the processing of the input data. Let’s suppose we have a classic feedforward network with an autoconnection. Then, with input x(0) at time t=0 the network will produce an output y(0). However, at time t=1, inputs to the network will be x(1) as well as the previous output y(0) travelling back to the input layer via the auto-connection. There! We have introduced the concept of time and memory into a static neural network. Long Short Term Memory units, or LSTM units for short, take the memory concept to the next level. Through a series of gates, they can perfect what to remember and what to forget, what to keep from the input, what to produce as output, and what to store in the unit state. And indeed, they have been applied successfully to a number of time series analysis problems.
[Rosaria] Still on modeling. If I decide to use an ARIMA model, how can I pick the values for the three parameters of ARIMA for best forecast results?
[Maarit] As for many other questions in data science, the answer here relies on experience. Depending on the data and the business case, the three orders of the ARIMA model can change quite a bit. So, usually the best approach is to try a few different combinations and see from the test set which model gets the best results. This kind of experimental procedure has been implemented in the auto-ARIMA component. The component tries a few different orders for the ARIMA model and measures and compares the performances of the different ARIMA models. The best performing model is provided at the output port.
[Rosaria] And now for the elephant in the room. How much past is enough past? How long do we need to go back in history to have enough data?
[Daniele] Yes! This is another very popular question! Again, there is no pre-packaged straightforward answer to this question. It is a compromise. Of course, the more past you use the more information the model gets, the more accurate the model will be. However, you must agree that it would be useless to include uninformative data. One standard practice, for example, is to estimate seasonality in the time series and then provide a past time window that covers the seasonal period. Again, it is a trade-off between how much past is necessary to model the temporal features and how much past the model and the tool can handle.
[Rosaria] Can I train a model for time series prediction with very little past? Can I use the PROPHET library for this?
[Corey] The PROPHET library does seem to perform acceptably on time series especially with very few values sampled in the past. It has not been integrated into our KNIME components for Time Series Analysis yet. But you can still apply it using the Python integration that is part of KNIME Analytics Platform.
[Rosaria] We have seen how to train a model for time series prediction. Now, which error metric should I use to evaluate the predictive model’s performance?
[Maarit] In literature, there are many metrics that fit numerical predictions. The most common metrics are: Mean Absolute Error (MAE), Mean Squared Error (MSE), Root Mean Squared Error (RMSE), Mean Absolute Percentage Error (MAPE), Mean Signed Difference (MSD), and also R^2. However, R^2 is not the preferred metric to measure the quality of time series predictions. This is because, especially for time series with large variance, the value gets squashed quickly close to 1 and improvements in prediction quality become hard to notice.
[Rosaria] How can I check model quality and consistency in time series analysis? For example, to prevent over-parameterizing the model?
[Daniele] The most effective way to check for model quality is still to measure performance on a test set, using one of the measures that Maarit has listed. We set a threshold under which performance is not acceptable and the model must be changed and retrained. We can always automate this part - checking whether performance falls below or above the threshold with a simple rule.
[Rosaria] One question about deployment. How can you ensure that the data preparation part is exactly the same in training and in deployment? How can you ensure that the deployment data are consistent with the training data?
[Corey] Yes, this is the deployment syndrome. You have a great model, it all works; but then, when transferring it into production, something gets lost in translation and pre-processing is not exactly the same in training and in deployment. The tool you use should provide some safe deployment features. KNIME software, for example, provides the integrated deployment feature exactly so as to make sure that nothing is lost in translation.
[Rosaria] Still about deployment. How can we deal with intermittent demand when the data change because of external factors? Let’s take the COVID pandemic as an example. The data have changed. Do we need to rebuild the models? When do we need to rebuild the models?
[Corey] Life in the real world is not that easy. Models are trained on a training set and tested on a test set, which usually come from an original dataset, sampling the system at a certain point in time. But then the system changes, the data used in the lab are no longer representative and the model becomes inadequate. The system can change slowly and produce a data drift, or suddenly produce a data jump. In both cases, continuous monitoring of the model performance on new samples of the system data should provide a warning of its inadequacy.
[Rosaria] How can I avoid data leakage in time series analysis?
[Maarit] When preparing data for time series analysis, you should make sure that you preserve the time order of the data. You need to reserve the older data for training and the most recent data for testing. You train on the past to predict the future. In KNIME Analytics Platform, the Partitioning node, which is the node used to create training and test sets, has a dedicated “Take from top” option, which allows the past to be separated from the future, if the data rows are time ordered.
[Rosaria] It seems we have moved into the data preparation phase. Let’s continue with a few questions on this topic then. What preprocessing steps do you recommend to make a time series stationary?
[Daniele] Well, first of all removing an seasonality. Usually this alone already makes a good contribution towards stationarity. If no seasonality is detected, it is standard practice to apply the first-order difference to a non-stationary time series, in order to stabilize the average value. The logarithm transformation is also often used to stabilize the variability of the time series across time.
[Rosaria] Do I need to decompose the signal before training the model? If yes, why?
[Daniele] The answer here is connected to the previous answer. Removing seasonality and applying the model to the time series residuals only usually helps with model quality.
[Rosaria] If I decompose the signal and train the model, do I need to rebuild the signal at the end? How can you restore seasonality and trend to the forecasted residual values?
[Corey] It depends on the kind of prediction. If you predict whether or not the stock price will rise, then there is no need to reintroduce the seasonality into a yes/no kind of classification. However, if we need to show the predicted price value, then the reintegration of the seasonality is mandatory. To do that, there is a node in the Time Series components: the Return Seasonality component. It does exactly that. It takes the predicted residuals and adds the seasonality back in.
[Rosaria] How is dimensionality reduction used for a regression problem? How do you decide on the most important features?
[Corey] The classic techniques for dimensionality reduction apply to time series as well. If it turns out that x(t), x(t-24) and x(t-48) are highly correlated, we can take just one of them. By the way, this would mean that the time series has a 24h seasonality and removing seasonality would already take care of this dimensionality reduction trick. If we want to know which past sample is contributing the most to the prediction, we can run a backward feature elimination procedure.
[Rosaria] Another question we are asked often is about the mechanism of time series analysis in KNIME Analytics Platform. I would like to elaborate on that one personally!
[Rosaria] The time series components in KNIME Analytics Platform help you throughout the entire time series analysis journey: from preprocessing, seasonality removal, and removing non-stationarity, through to training and scoring a model. However, it is impossible to describe the whole procedure in an answer of just a few lines. For more information, you can read the blog post Building a Time Series Analysis Application or attend the next online course on Time Series Analysis on November 16-17, 2020 at the online KNIME Fall Summit. There Daniele, Corey, and Maarit explain the whole process for time series analysis in detail and provide exercises based on real use cases.
With this last question and answer we can close this interview. I would like to thank Daniele, Corey, and Maarit for giving us the opportunity to learn something new, but especially for putting together the time series components for KNIME Analytics Platform and the course “[L4-TS] An Introduction to Time Series Analysis”.
Some of the questions and answers reported in this article are taken from the webinar Time Series Analysis: Panel Discussion run on July 13 2020.
Continue reading and listening


Stay in the loop.
Subscribe to our newsletter for a weekly update on the latest podcast, news, events, and jobs postings.